Calculation of weighted peak indices for low and intermediate frequency magnetic field sources
Premise
In 2008, the then ISPESL promoted a research project (in which, in addition to ISPESL, operational units of IFAC and ENEA participated) to further evaluate the exposure to EMF of operators working in magnetic resonance imaging (MRI) departments. The project had mainly dosimetric objectives, to achieve which it was necessary to develop a method for acquiring the waveforms of the gradient magnetic fields in the time domain. These waveforms are also fundamental for the determination of the weighted peak indexes, which were becoming widespread in those years and which would become particularly important with the publication of the 2010 ICNIRP guidelines for the prevention of the stimulation effects of excitable tissues.
This method subsequently evolved into the definition of a real instrumental chain (schematically shown in the figure), proposed as a possible standard solution to the problem of evaluating occupational exposure to gradient fields in MRI. The chain included a Narda ELT-400 meter with a 100 cm2 probe, an Agilent U2351A acquirer (connected to the analog output of the meter) and a personal computer (laptop), in turn connected both to the acquirer by means of a USB connection and to the meter with a standard RS232 connection. The personal computer was running a program for managing the chain and acquiring the measured data, developed by ENEA in a LabVIEW environment.
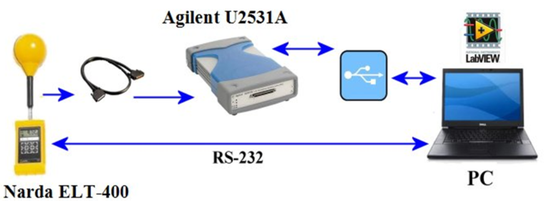
The web tool to which this information sheet refers was created to allow processing of the data files produced by that instrumental chain and therefore relating to low-frequency magnetic induction measurements, not necessarily limited to the case of gradient fields in MRI.
Purpose
This tool allows processing of low-frequency magnetic field measurements (within the band limits managed by the ELT-400 meter), to obtain some radioprotection parameters provided for by the current legislation and first of all the weighted peak indices for the stimulation effects referred to any regulatory limit (not only those for which the index is provided directly from the meter display).
The instrument is particularly useful when dealing with magnetic induction waveforms that vary in a complex way over time, with spectral components all contained within the maximum frequency specified for the meter.
General setting
The instrument is designed to process the data files produced by the Agilent U2531A acquisition device connected via its USB interface to a personal computer running a special management and acquisition software developed at ENEA.
Each single measurement produces multiple data files (each relating to a 1-second time fragment) consisting of vector samples of magnetic induction acquired at successive instants of time. These data files, conveniently arranged, are sent to the WebNir server, where they are assembled in the specified order and subsequently processed to calculate the radiation protection parameters and build the graphs reported among the results.
Limitations
The main limitation is linked to the fact that the instrument is only suitable for a specific and particular measurement chain. However, this chain has characteristics of notable flexibility, being able to be used in relation to many sources of low-frequency magnetic induction and to any trend of the regulatory limits. The chain in question can still be assembled by any interested parties, since both the meter Narda ELT-400 and the acquisition device Agilent (today Keysight) U2351A continue to be commercially available; ENEA has also expressed its willingness to provide information and to make available the chain control software and the necessary data conversion utilities associated with it, without prejudice to the possible difficulties due to the evolution of digital platforms that have occurred since the development era; for any need in this regard, it is possible to contact the engineer Rosanna Pinto (+39-06-3048.4076, rosanna.pinto@enea.it).
As for the technical limitations, to avoid unacceptably long processing times and excessive use of the server's computing resources:
- the calculation of the maximum ΔB variation over 3 seconds is performed only if the product of the sampling frequency and the number of samples is less than 1 MHz;
- the calculation of the weighted peak indices is performed only if the sampling frequency is at least 10 Hz and the overall duration of the sampled interval is less than 100 s.
- Set the operating mode of the ELT-400 (probe type, Mode, Range).
- Enter the sampling frequency and the unit of measurement.
- Choose the set of data files that correspond to a single measurement to be processed (usually 10 or 20). The files must be on the PC you are working on.
- ATTENTION! Make sure that the files are listed in the right order (most likely the no. 10 will be out of place). Reorder them by dragging the names to the right place.
- Finally press the "Process" button. You will have to wait a few minutes for the files to load (highlighted by a special progress indicator, not working on some versions of Microsoft Edge), depending on their size and network speed. Once the files are transferred, the processing itself is quite fast.
- The results (which appear at the bottom of the page) consist of a table containing a series of numerical data:
- sampling period
- number of samples
- maximum modulus value
- RMS value
- five WP indices calculated in the time domain
- Load more data and select the relevant options to perform a new processing.
The
Reset
button is used to clean up the interface, but if you don't press it the calculation is re-executed with the current settings.
Keywords: Weighted peak indices, Magnetic field, Processing