Interpolation of index measurements and calculation of the compliance distance with determination of the uncertainty
Purpose
This tool allows you to determine the respect distance from an EMF source, with evaluation of the associated uncertainty, by interpolating the measurements of an index of exposure, acquired along a straight line on which they are aligned the measurement points, placed at various distances from the source itself.
How to use
How to use the tool can be summarized in the points following.
- The user must locate the straight line along which he wants to determine the respect distance; the points of this directrix move away from the source in approximately radial direction.
- On this line, the user must define a coordinate axis, which can have any origin and direction. Now both the measurement positions and the the respect distance that will be calculated.
- The user must therefore establish which exposure index intends to measure, choosing it based on the characteristics of the source (for example if field electric, magnetic field or electromagnetic field), the frequency and the regulations it intends to apply.
- The user must then detect the value of the chosen index, measuring it in a suitable number of points along the line identified, at various distances from the source.
- Finally, the user must prepare a data file
where to report the coordinate of each measurement point
(one point for each line of the file) referred to the coordinate axis
above followed by the index value detected in that
point(expressed on a unit or percentage basis). For the
structure of this data file, the steps relating to its
processing and presentation of the results is postponed
to the
Instructions
tab. - The uncertainty of the clearance distance is determined propagating the absolute error values on the position of the point of measurement and absolute and/or relative error on the value of the measured index.
Limitations
- The measurements must refer to index values of exposure, not of field strength or power density. In the case of measurements on signals with complex waveform, that's for more the only sensible approach to measurement. In the case of measurements on perfectly sinusoidal signals, for which they can you can also use the field strength values obtain the value of an index that can be used in this application by dividing each measured value by the value regulatory limitin relation to which you want determine the respect distance.
- The determination of the respect distance requires that you have acquired measurements at both distances smaller, or at a distance greater than the distance sought, because the application only performs interpolations and not extrapolations. In case the distance of respect falls outside the acquired measurement range, interpolation - if possible - will be performed equally, but no value will be provided for the respect distance.
- In some cases, if the trend of the measured values yes deviates significantly from the polynomial curve used for interpolation, the latter will be able to fail without producing any useful results.
Examples
The following text files can be used as example data files relating to index measurements as a function of distance, suitable for determination of the clearance distance through interpolation polynomial; these are data acquired during measurement campaigns real:
- Measures of gradient magnetic field in MRI
- Field measurements electrical energy dispersed by an electrosurgical device
- Measurements of Dispersed magnetic flux density from an arc welding machine with technology MIG
- Measurements of dispersed magnetic flux density from a stimulation apparatus transcranial
| Input file parameters |
|---|
Data file format
- The data file passed to this application must be a standard ASCII text, therefore preferably without accented characters or special, Greek letters or other non-standard signs.
- The file must have a
txt
extension and a maximum size of 10 kB. - It must consist of a succession of lines, which can be comment lines or data lines.
- Lines preceded by characters; # ! (semicolon, pound sign or exclamation point) are considered comments and are not taken into consideration for processing. I am comments in line with each pair of are also eligible measurement data.
- Each of the rows containing data must match
to a single measurement point and consist of a
pair of numeric values, separated by a comma, one or
multiple spaces or a
tab
character. - The first value of the pair indicates the distance from the source (or more precisely the position on the coordinate axis along which the measurements are performed), with units of measurement that can be specified in the user interface (default meters), but which must be the same for everyone the points. The second is the radiation protection index measured, expressed on a unit or percentage basis; the base, to be specified in the interface, it must be the same for all measured values; the default value is percentage-based indices. After the second value of the couple, a comment can possibly be inserted, preceded by one of the distinctive characters above.
- In numeric values, the decimal point is the period; decimal or exponential scientific notation is permitted.
Example
 # Comment 1
 ! Comment 2
 0.20,99.99
 0.40,17.06
 1.16,1.04
 1.20,1.00 ;Comment on a specific measure
 1.80,0.24
Other examples are available in the Presentation.
Constraints on incoming data
- The absolute distance error cannot be > 10 cm.
- The relative error on the index cannot be > 50%.
- The absolute error on the index cannot be > 10 if the index is calculated on a percentage basis, > 0.1 if calculated on a per unit basis.
Procedure
- Switch to the Data Entry tab.
- Press the
Data File
button and select the data file containing the measurements you want to process. - Select
Percentage Based Indexes
orIndexes on a unitary basis
, as the case may be. - Select the unit of distance measurement, a depending on the case.
- Optionally specify the error value provided by the application.
- Select
Graph with linear ordinate axis
orGraph with logarithmic ordinate axis
. - Press the
Process
button and wait for completion of processing. - Switch to the
Results
tab to view the textual and graphical results: some information relating to calculation time and the interpolation procedure, one summary table with the input file data (downloadable in PNG or XLS format) and a graph with the result of the interpolation and the value of the respect distance (also downloadable in PNG format). - Return to the
Data Entry
tab and press theReset
button if you want to reset the application to proceed with a new processing.
Data file for non-homogeneous errors
You can also use data files with a 3, 4 or 5 columns, in in order to support measurements with non-homogeneous errors:
- file with 3 columns:
- the third column is interpreted as relative error on the index;
- the absolute error on the index and that on the distance, equal for all points, are obtained from the entry form data;
- file with 4 columns:
- the third column is interpreted as relative error on the index;
- the fourth column is interpreted as absolute error on the index;
- the absolute error on the distance, equal for all points, is obtained from the data entry form;
- file with 5 columns:
- the third column is interpreted as relative error on the index;
- the fourth column is interpreted as absolute error on the index;
- the fifth column is interpreted as an absolute error on distance.
Depending on the number of columns present in the file loaded, the fields to be ignored in the input form are enabled or they disable consistently with the number of columns specified, as yes you can see by clicking on the following images:
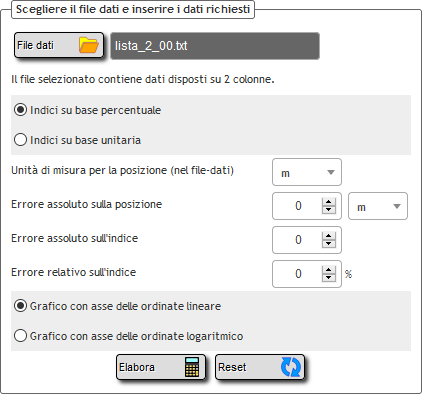
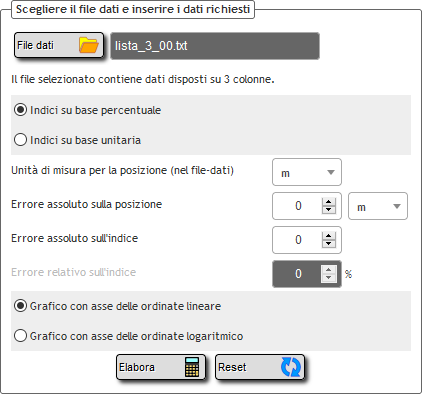

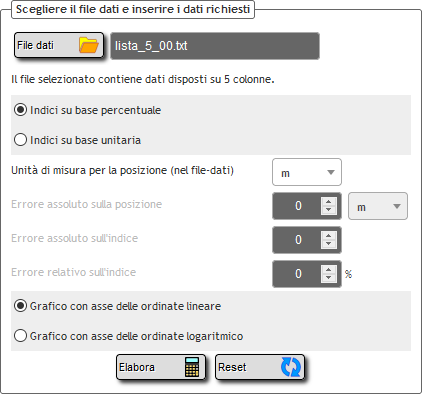
Since inserting errors via the yes disable part of the UI, it's no longer It is possible to specify the unit of measurement of the error on the distance, which is implied to be homogeneous with the unit measuring for the position.
Particular attention should also be paid to values inserted, as the validity check is missing on the range of input data for disabled fields.
The following are some examples file with data on 3, 4 and 5 columns:
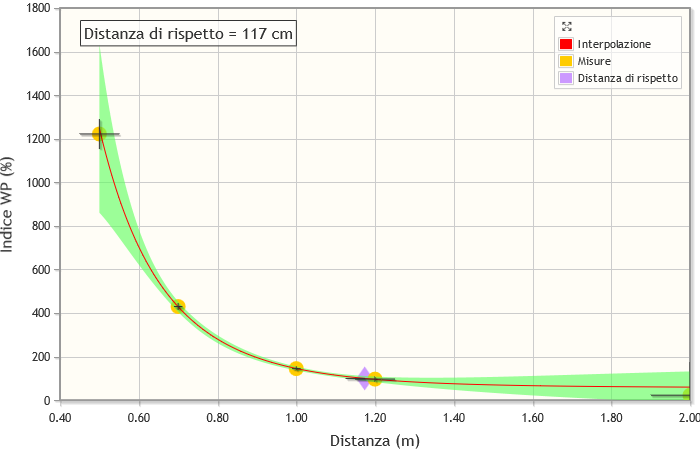
and the display of a graph obtained by imposing non-values homogeneous for the various errors (the errors associated with the measurements at the extremes have been deliberately accentuated):
Keywords: Interpolation, Weighted peak index, Respect distance, Measurement uncertainty